

Most marathon training advice traces back to a handful of coaches, a few well-known plans, and a lot of inherited wisdom passed between runners at track sessions. The problem is that very little of it was built on large-scale data.
That changed in late 2024, when researchers published training logs from 119,452 Strava users across 151,813 marathon performances.
Paired with a 917-runner Boston Marathon cohort study and an analysis of 92 sub-elite training plans, this guide represents the largest body of real-world marathon training data ever assembled.
The findings challenge several assumptions that most runners and coaches treat as settled. Here’s what you’ll learn…
- How much weekly volume sub-3 runners actually log, and how that compares to every other finish-time bracket
- Why faster runners spend more time in Zone 1, and what that means for your intensity split
- Why your long run distance probably isn’t what’s holding you back
- The specific training changes in the final 4 months that predicted faster Boston Marathon times
- How the gap between your 10K pace and marathon pace narrows as volume increases
How Much Do Sub-3 Marathon Runners Actually Train Per Week?
The short answer: a lot more than most runners expect.
A 2024 study published in Sports Medicine analyzing 119,452 runners found that the fastest marathon finishers (120 to 150 minutes) accumulated more than 3x the weekly training volume of average finishers.

Across all runners in that dataset, the average weekly volume was 45.1 km per week (28 miles per week). That number includes everyone from first-timers to experienced racers.
The fastest group was training well above 100 km per week (62+ miles per week).
Coaching data from Front Runner Sports puts the average peak 4-week volume for their sub-3 athletes at 120 km per week (75 miles per week), with a range spanning 66 to 170 km (41 to 106 miles).
This data lines up perfectly with the training logs we collected from our own coached athletes: sub-3 runners averaging 55 to 60 miles per week (88 to 97 km), with peak weeks reaching 65 to 70 miles (105 to 113 km).
The correlation between weekly volume and marathon time was strong across the Strava dataset, explaining more than 90% of the performance variation between finish-time groups.
| Finish Time | Avg Weekly Volume (km) | Avg Weekly Volume (miles) |
|---|---|---|
| Sub-2:30 | ~107 | ~66 |
| Sub-3:00 | ~80–120 | ~50–75 |
| 3:00–3:30 | ~64–72 | ~40–45 |
| 3:30–4:00 | ~50–60 | ~31–37 |
| 4:00+ | ~35–45 | ~22–28 |
The gap between a 4:00+ finisher and a sub-3 finisher often represents 40 to 50 extra kilometers per week (25 to 31 miles). That volume difference is the single largest training variable separating performance tiers.
Why Do Faster Marathon Runners Spend More Time Running Easy?
The instinct for most runners chasing a faster time is to add harder workouts. The data says the opposite is more effective.
Across 151,813 marathon performances, the amount of training time in Zone 2 and Zone 3 remained relatively stable across all performance levels. The proportion of Zone 1 running was higher in progressively faster groups.
The researchers used a 3-zone model with critical speed as the boundary.
- Zone 1 is easy aerobic running
- Zone 2 is moderate/threshold work
- Zone 3 is high-intensity intervals
Faster runners didn’t accumulate meaningfully more time in the hard zones. They accumulated dramatically more time in Zone 1. The extra volume that separated fast from slow was almost entirely easy running.
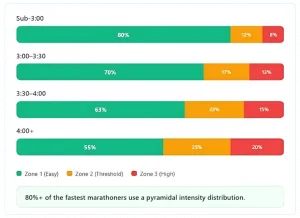
More than 80% of runners with the fastest marathon times used a pyramidal training intensity distribution, where the majority of training sits in Zone 1, with progressively less time in Zone 2 and even less in Zone 3.
The prevalence of this pyramidal structure increased in faster performance groups.
A separate analysis of over 100,000 Strava marathoners found the same pattern. Fastest runners devoted approximately 80% of total mileage to easy effort, while most runners spent only 50 to 60% at easy pace.
Zone 1 volume is the single strongest differentiator between fast and average marathon runners.
An analysis of 92 sub-elite marathon training plans confirmed this structure.
Across all volume groups, the intensity distribution was pyramidal: roughly 13% Zone 1, 66% Zone 2, 15% Zone 3, and 6% combined in Zones 4 and 5 (using a 5-zone model). Even the lowest-volume plans followed this same shape.
If you’re running 3 hard sessions a week and 2 easy days, your intensity distribution is inverted compared to what the fastest runners actually do.
Most of the volume increase that improves marathon performance should come from adding easy mileage.
Does a Longer Long Run Actually Make You Faster at the Marathon?
The long run is the training session most marathon runners worry about most. But the data suggests its length matters less than you’d think.
An analysis of 92 sub-elite marathon training plans found that the peak long run distance was approximately 30 to 32 km (19 to 20 miles) across all 3 volume groups, whether the plan averaged 43 km/week or 108 km/week.
That finding is striking. The high-volume group averaged 2.5x the weekly mileage of the low-volume group, yet both prescribed nearly identical long run distances.
What separated the groups was everything around the long run.
High-volume plans packed more easy mileage into the other 5 to 6 days of the week. Their long run represented a smaller proportion of total weekly volume, roughly 25 to 30%, compared to 50% or more in low-volume plans.
This ratio matters because a long run that accounts for half your weekly volume is a very different physiological stimulus than one that accounts for a quarter of it.
If your long run is already 30 to 32 km (19 to 20 miles) and your marathon time has plateaued, adding another 3 km to the long run is unlikely to help.
Adding 15 to 20 km of easy running spread across the rest of the week probably will.
Do Structured Workouts Improve Marathon Times Beyond Just Running More?
Volume gets the headlines, but the Boston Marathon cohort data shows that quality sessions carry independent weight.
In a study of 917 Boston Marathon runners, each additional quality session per week was associated with a 16.2-minute improvement in finish time.
That effect size is remarkable, especially given the sample. The Boston cohort was 95% “trained/developmental” runners with an average of 9 years of dedicated marathon training and 16 previous marathons completed.
By comparison, each additional kilometer of weekly distance was associated with only a 0.6-minute improvement, and each additional running session of any kind improved times by about 3.6 minutes.
The data suggests that structured hard sessions, including tempo runs, intervals, and marathon-pace work, contribute to marathon performance in ways that simply accumulating more easy miles does not fully replicate.
This fits cleanly within the intensity distribution finding. The fastest runners still do most of their running easy, but the quality sessions they include are intentional, specific, and consistent.
The Boston data showed that runners who increased their number of quality sessions in the final 4 months before the race outperformed those who didn’t, even when total weekly distance was similar.
Years of marathon experience and total number of previous marathons were not significant predictors of race time in the same model.
Each additional quality session per week predicted a 16.2-minute faster marathon time in the Boston 2022 cohort, roughly 4.5x the effect of adding a single extra running session of any type.
The takeaway: easy volume is the foundation, but 1 to 2 well-placed quality sessions per week provide disproportionate returns. The data supports doing both simultaneously.
What Does the Data Say About Tapering for a Marathon?
Tapering advice varies wildly between training plans. But once again we can rely on data to give us a structure and framework to build our training plan from.
A 2023 systematic review found that the optimal total volume reduction during a taper is 41-60% across the entire taper period, applied progressively rather than all at once.
In addition, research has shown that maintaining intensity at 85-95% VO2max during the taper produces optimal results, which for marathon runners translates to marathon pace through half marathon pace, not 5k speed.
If you’re following a plan that has you doing easy jogging for the final 2 weeks with no structured work, the data suggests you’re leaving fitness on the table.
Does Cross-Training Actually Help Marathon Performance?
Cross-training gets treated as optional filler in most marathon plans. The Boston cohort data suggests it deserves more credit, with an important timing nuance.
In the final 4 months before the race, each additional cross-training session per week was associated with a 6-minute improvement in finish time.
That effect was independent of running volume and quality session frequency.
The same relationship did not appear in the 12-to-4-month training window, suggesting cross-training’s performance benefit is concentrated in the race-specific phase when cumulative fatigue is highest.
Runners who increased both running sessions and cross-training sessions in the final 4 months saw an additional synergistic effect beyond either activity alone.
The study didn’t specify which types of cross-training were most effective, but the independent effect size suggests that cycling, swimming, or other non-impact aerobic activities contribute meaningfully when layered on top of a running base.
How Does Training Volume Affect the Gap Between Your 10K Pace and Marathon Pace?
One of the clearest patterns in the coaching data involves the relationship between training volume and how close a runner can sustain their marathon pace to their 10K pace.
Front Runner Sports tracked 65 coached athletes who broke 3 hours, measuring both their peak 4-week training volume and their 10K time as a proxy for anaerobic threshold.
The pattern was consistent: as weekly volume increased, the gap between 10K pace and marathon pace narrowed.
Runners with higher sustained volume could hold a pace closer to their threshold speed for the full 42.2 km.
The coaching team’s conclusion captures the relationship well: your anaerobic threshold determines the ceiling of your marathon pace, and your peak sustainable volume determines how close you can get to that ceiling.
Among their sub-3 athletes, peak volume ranged from 94 km/week (58 miles/week) in the 2:50 to 2:59 group to 160 km/week (99 miles/week) in the sub-2:20 group.
Each step up in volume corresponded with a smaller gap between 10K and marathon race pace.
This explains why two runners with identical 10K times can produce very different marathon results.
The runner with more aerobic volume can sustain a higher percentage of threshold pace for longer.
What Separates Sub-3 Marathon Runners from Everyone Else?
Across all 4 datasets, the same variables keep emerging. Here’s how the key training metrics break down by finish-time bracket:
| Training Variable | Sub-3:00 | 3:00–3:30 | 3:30–4:00 | 4:00+ |
|---|---|---|---|---|
| Avg Weekly Volume | 80–120 km (50–75 mi) | 64–72 km (40–45 mi) | 50–60 km (31–37 mi) | 35–45 km (22–28 mi) |
| Easy Running (Z1) % | ~80% | ~70% | ~60–65% | ~50–60% |
| Peak Long Run | 30–32 km (19–20 mi) | 30–32 km (19–20 mi) | 29–32 km (18–20 mi) | 26–32 km (16–20 mi) |
| Quality Sessions/Week | 2–3 | 1–2 | 1–2 | 0–1 |
| Training Days/Week | 6–7 | 5–6 | 5–6 | 3–4 |
| Intensity Distribution | Pyramidal | Pyramidal | Mixed | Often inverted |
The pattern across every study points to the same hierarchy of importance:
- Total aerobic volume explains more performance variation than any other single variable, accounting for more than 90% of performance variation in the Strava dataset.
- Intensity distribution separates tiers. Faster runners accumulate their extra volume almost entirely in Zone 1 easy running.
- Quality session consistency contributes independent performance gains worth roughly 16 minutes per additional session per week.
- Long run length is essentially constant across all performance groups. The difference is how much training surrounds it.
- Taper protocol favors reducing volume by 41 to 60% over 2 weeks while maintaining workout intensity.
- Cross-training carries an independent association with faster times, worth approximately 6 minutes per additional session.
What Does This Mean for Your Training?
If you’re training for a marathon and wondering where to direct your effort, the data points to a clear priority order.
First, look at your total weekly volume.
If you’re running 40 km per week (25 miles) and targeting sub-3:30, you’re likely undertrained by 20 to 30 km per week (12 to 19 miles) relative to runners who hit that mark.
Second, check your intensity split.
If more than 25 to 30% of your running is at moderate or hard effort, you’re probably running your easy days too fast. The fastest runners in the Strava dataset ran roughly 80% of their volume in Zone 1.
Third, protect your quality sessions.
One to 2 structured workouts per week at tempo, interval, or marathon-pace effort produce outsized returns. The Boston data showed these sessions predicted faster times independent of total volume.
Fourth, stop chasing a longer long run i
The data shows that long run length is nearly identical across all performance levels. The performance difference comes from the other 5 to 6 days of training.
The data from these studies paints a consistent picture…Faster marathon runners build a massive aerobic base of easy running, add targeted quality sessions on top of it, and taper intelligently.
The formula isn’t complicated. Executing it consistently over 16+ weeks is the hard part.